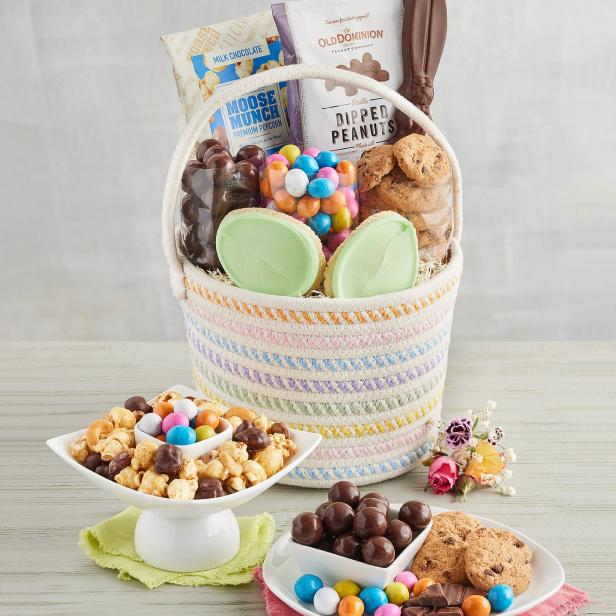
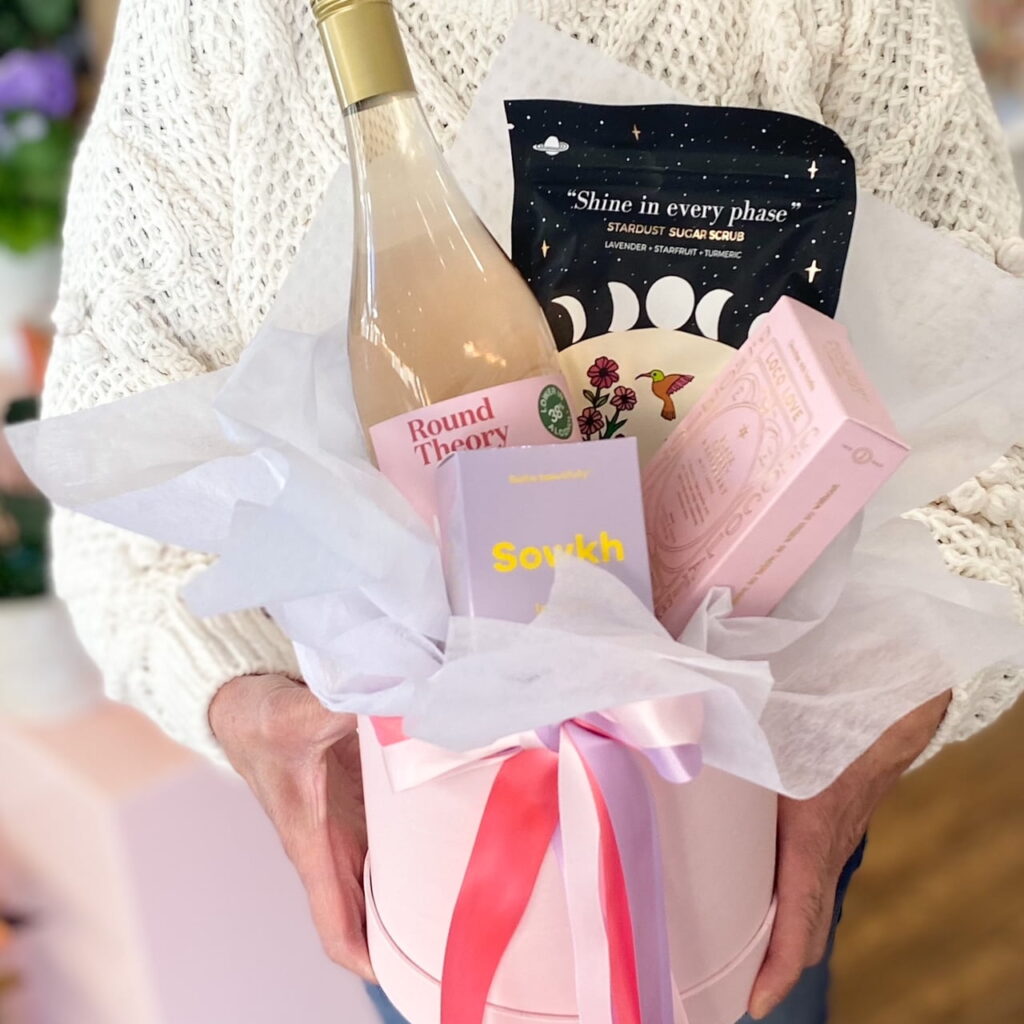
FORGE Supplements, FUTURE KIND, and Jarrow Formulas Inc. will emerge as major vegan supplements market
NEW YORK, Sept. 5, 2022 /PRNewswire/ — The latest market analysis report titled Vegan Supplements Market by Distribution Channel and Geography – Forecast and Analysis 2022-2026 has been added to Technavio’s catalog. The report predicts the market to witness an accelerating growth momentum at a CAGR of 8.1%. Technavio categorizes the global vegan supplements market as a part of the global packaged food and meat under the global food products segment of the global food, beverage, and tobacco market. The data available in our value chain analysis segment can help vendors drive costs and enhance customer services during the forecast period.
Read a FREE Sample Report for Insights on the Market Scope and Value Chain Analysis
Vegan Supplements Market Segmentation Highlights
- Distribution Channel
- Offline: The vegan supplements market share growth in the offline segment will be significant during the forecast period. The offline segment of the global vegan supplements market comprises supermarkets, hypermarkets, departmental stores, pharmacies, and other stores. Retail outlets attract a high footfall as products such as vegan supplements are on display, and sales representatives present at the stores guide buyers in selecting products as per their requirements.
- Online
- Geography
- Europe: 37% of the market’s growth will originate from Europe during the forecast period. Germany and UK are the key markets for vegan supplements in Europe. Market growth in this region will be faster than the growth of the market in the North American and MEA regions. Consumers in Europe are mainly focusing on health, leading to the greater adoption of food products manufactured from plants. This will facilitate the vegan supplements market growth in Europe over the forecast period.
- North America
- APAC
- South America
- Middle East And Africa
View PDF Sample for Segment-wise Insights and Regional Contributions
Key Considerations for Market Forecast:
- Impact of lockdowns, supply chain disruptions, demand destruction, and change in customer behavior
- Optimistic, probable, and pessimistic scenarios for all markets as the impact of pandemic unfolds
- Pre- as well as post-COVID-19 market estimates
- Quarterly impact analysis and updates on market estimates
Top 5 Vegan Supplements Market Participants:
FORGE Supplements
The company offers a range of supplements for daily health, workout pump, fat burning, and focus. The company offers SOLAR 2.0 thermogenic fat burner which has been designed to speed up metabolism, thermogenically burn calories, and suppress appetite/cravings
FUTURE KIND
The company is involved in offering clean, sustainable, and plant-based nutrient products to complement health supplements for humans. The company offers vegan chocolate protein powder which helps the body to build muscle, repair tissue and meet protein goals.
Jarrow Formulas Inc.
The company is involved in offering a wide range of products in the category of amino acids, antioxidants, brain health, bone nutrition, and many more. The company offers saccharomyces boulardii vegan supplement that helps to protect and maintain intestinal microflora and support healthy microflora balance.
Kikkkoman
The company offers MAX for Vegans supplements in the form of capsules that contain vitamin B12, iron supplements, and amino acids, thus designed as certified vegan and gluten-free for health purposes.
Natrol LLC
The company offers vitamins, minerals, hormones, and supplements for a wide category of health and wellness applications. The company offers vegan supplements such as Natrol Easy C tablet which has high potency antioxidant and contains vitamin C supplements essential for optimal nutrition, thus designed to support immune health.
Request for a FREE Sample PDF for Vendor-Specific Insights and Investment Opportunities
Vegan Supplements Market Dynamics
- Expanding global vegan population base to Influence Market Growth Positively
With the rising awareness about the various health benefits of vegan diets, the number of people adopting vegan lifestyles is increasing across the world. Vegan diets provide more fibers, antioxidants, and beneficial plant compounds. Furthermore, vegan diets help improve kidney function and lower blood sugar levels. The number of vegan consumers is growing in countries such as the US and Canada. The number of people adopting a vegan lifestyle is growing in countries such as the UK, Germany, and France. Thus, the growing global vegan population will help in the growth of the global vegan supplements market during the forecast period.
- Growing prominence of Online Shopping Likely to Trend
E-commerce enables customers to access regional and global brands of vegan supplements. Brand-owned online portals and pure-play e-retailers are among various types of e-commerce platforms offering vegan supplements. E-commerce vendors allow customers to collect information and compare various vegan supplements available on the portal. With the increasing online retailing, the sales of vegan supplements through this channel are expected to increase significantly.
Download Sample PDF for More Market Dynamics and their Impact
Reports that might interest you:
Vegan Supplements Market in North America by Distribution Channel and Geography – Forecast and Analysis 2022-2026
Supplements Market in US by Product and Distribution Channel – Forecast and Analysis 2021-2025
Probiotic Dietary Supplements Market by Application and Geography – Forecast and Analysis 2021-2025
Probiotic Supplements Market in Canada by Type and Disease Type – Forecast and Analysis 2022-2026
Dietary Supplements Market by Product and Geography – Forecast and Analysis 2021-2025
Protein Supplements Market by Distribution Channel and Geography – Forecast and Analysis 2021-2025
Vegan Supplements Market Scope |
|
Report Coverage |
Details |
Page number |
120 |
Base year |
2021 |
Forecast period |
2022-2026 |
Growth momentum & CAGR |
Accelerate at a CAGR of 8.1% |
Market growth 2022-2026 |
$ 3.43 billion |
Market structure |
Fragmented |
YoY growth (%) |
7.7 |
Regional analysis |
Europe, North America, APAC, South America, and Middle East and Africa |
Performing market contribution |
Europe at 37% |
Key consumer countries |
US, China, Japan, Germany, and UK |
Competitive landscape |
Leading companies, competitive strategies, consumer engagement scope |
Companies profiled |
Amway Corp., Deva Nutrition LLC, Du Pont De Nemours Inc., FORGE Supplements, FUTURE KIND, Glanbia Plc, HTC Health, Jagzee Enterprises, Jarrow Formulas Inc., Kikkkoman, Natrol LLC, Nestle SA, NOW Health Group Inc., Nuzest Life Pty. Ltd., Pure Encapsulations LLC, Sakara Life Inc., Solgar Inc., Unived, Vital Amine Inc., and Wonder Laboratories |
Market Dynamics |
Parent market analysis, Market growth inducers and obstacles, Fast-growing and slow-growing segment analysis, COVID-19 impact and future consumer dynamics, and market condition analysis for the forecast period. |
Customization purview |
If our report has not included the data that you are looking for, you can reach out to our analysts and get segments customized. |
Table of Content
1 Executive Summary
- 1.1 Market overview
- Exhibit 01: Executive Summary – Chart on Market Overview
- Exhibit 02: Executive Summary – Data Table on Market Overview
- Exhibit 03: Executive Summary – Chart on Global Market Characteristics
- Exhibit 04: Executive Summary – Chart on Market by Geography
- Exhibit 05: Executive Summary – Chart on Market Segmentation by Distribution Channel
- Exhibit 06: Executive Summary – Chart on Incremental Growth
- Exhibit 07: Executive Summary – Data Table on Incremental Growth
- Exhibit 08: Executive Summary – Chart on Vendor Market Positioning
2 Market Landscape
- 2.1 Market ecosystem
- Exhibit 09: Parent market
- Exhibit 10: Market Characteristics
3 Market Sizing
- 3.1 Market definition
- Exhibit 11: Offerings of vendors included in the market definition
- 3.2 Market segment analysis
- Exhibit 12: Market segments
- 3.4 Market outlook: Forecast for 2021-2026
- Exhibit 13: Chart on Global – Market size and forecast 2021-2026 ($ million)
- Exhibit 14: Data Table on Global – Market size and forecast 2021-2026 ($ million)
- Exhibit 15: Chart on Global Market: Year-over-year growth 2021-2026 (%)
- Exhibit 16: Data Table on Global Market: Year-over-year growth 2021-2026 (%)
4 Five Forces Analysis
- 4.1 Five forces summary
- Exhibit 17: Five forces analysis – Comparison between 2021 and 2026
- 4.2 Bargaining power of buyers
- Exhibit 18: Chart on Bargaining power of buyers – Impact of key factors 2021 and 2026
- 4.3 Bargaining power of suppliers
- Exhibit 19: Bargaining power of suppliers – Impact of key factors in 2021 and 2026
- 4.4 Threat of new entrants
- Exhibit 20: Threat of new entrants – Impact of key factors in 2021 and 2026
- 4.5 Threat of substitutes
- Exhibit 21: Threat of substitutes – Impact of key factors in 2021 and 2026
- 4.6 Threat of rivalry
- Exhibit 22: Threat of rivalry – Impact of key factors in 2021 and 2026
- 4.7 Market condition
- Exhibit 23: Chart on Market condition – Five forces 2021 and 2026
5 Market Segmentation by Distribution Channel
- 5.1 Market segments
- Exhibit 24: Chart on Distribution Channel – Market share 2021-2026 (%)
- Exhibit 25: Data Table on Distribution Channel – Market share 2021-2026 (%)
- 5.2 Comparison by Distribution Channel
- Exhibit 26: Chart on Comparison by Distribution Channel
- Exhibit 27: Data Table on Comparison by Distribution Channel
- 5.3 Offline – Market size and forecast 2021-2026
- Exhibit 28: Chart on Offline – Market size and forecast 2021-2026 ($ million)
- Exhibit 29: Data Table on Offline – Market size and forecast 2021-2026 ($ million)
- Exhibit 30: Chart on Offline – Year-over-year growth 2021-2026 (%)
- Exhibit 31: Data Table on Offline – Year-over-year growth 2021-2026 (%)
- 5.4 Online – Market size and forecast 2021-2026
- Exhibit 32: Chart on Online – Market size and forecast 2021-2026 ($ million)
- Exhibit 33: Data Table on Online – Market size and forecast 2021-2026 ($ million)
- Exhibit 34: Chart on Online – Year-over-year growth 2021-2026 (%)
- Exhibit 35: Data Table on Online – Year-over-year growth 2021-2026 (%)
- 5.5 Market opportunity by Distribution Channel
- Exhibit 36: Market opportunity by Distribution Channel ($ million)
6 Customer Landscape
- 6.1 Customer landscape overview
- Exhibit 37: Analysis of price sensitivity, lifecycle, customer purchase basket, adoption rates, and purchase criteria
7 Geographic Landscape
- 7.1 Geographic segmentation
- Exhibit 38: Chart on Market share by geography 2021-2026 (%)
- Exhibit 39: Data Table on Market share by geography 2021-2026 (%)
- 7.2 Geographic comparison
- Exhibit 40: Chart on Geographic comparison
- Exhibit 41: Data Table on Geographic comparison
- 7.3 Europe – Market size and forecast 2021-2026
- Exhibit 42: Chart on Europe – Market size and forecast 2021-2026 ($ million)
- Exhibit 43: Data Table on Europe – Market size and forecast 2021-2026 ($ million)
- Exhibit 44: Chart on Europe – Year-over-year growth 2021-2026 (%)
- Exhibit 45: Data Table on Europe – Year-over-year growth 2021-2026 (%)
- 7.4 North America – Market size and forecast 2021-2026
- Exhibit 46: Chart on North America – Market size and forecast 2021-2026 ($ million)
- Exhibit 47: Data Table on North America – Market size and forecast 2021-2026 ($ million)
- Exhibit 48: Chart on North America – Year-over-year growth 2021-2026 (%)
- Exhibit 49: Data Table on North America – Year-over-year growth 2021-2026 (%)
- 7.5 APAC – Market size and forecast 2021-2026
- Exhibit 50: Chart on APAC – Market size and forecast 2021-2026 ($ million)
- Exhibit 51: Data Table on APAC – Market size and forecast 2021-2026 ($ million)
- Exhibit 52: Chart on APAC – Year-over-year growth 2021-2026 (%)
- Exhibit 53: Data Table on APAC – Year-over-year growth 2021-2026 (%)
- 7.6 South America – Market size and forecast 2021-2026
- Exhibit 54: Chart on South America – Market size and forecast 2021-2026 ($ million)
- Exhibit 55: Data Table on South America – Market size and forecast 2021-2026 ($ million)
- Exhibit 56: Chart on South America – Year-over-year growth 2021-2026 (%)
- Exhibit 57: Data Table on South America – Year-over-year growth 2021-2026 (%)
- 7.7 Middle East and Africa – Market size and forecast 2021-2026
- Exhibit 58: Chart on Middle East and Africa – Market size and forecast 2021-2026 ($ million)
- Exhibit 59: Data Table on Middle East and Africa – Market size and forecast 2021-2026 ($ million)
- Exhibit 60: Chart on Middle East and Africa – Year-over-year growth 2021-2026 (%)
- Exhibit 61: Data Table on Middle East and Africa – Year-over-year growth 2021-2026 (%)
- 7.8 US – Market size and forecast 2021-2026
- Exhibit 62: Chart on US – Market size and forecast 2021-2026 ($ million)
- Exhibit 63: Data Table on US – Market size and forecast 2021-2026 ($ million)
- Exhibit 64: Chart on US – Year-over-year growth 2021-2026 (%)
- Exhibit 65: Data Table on US – Year-over-year growth 2021-2026 (%)
- 7.9 China – Market size and forecast 2021-2026
- Exhibit 66: Chart on China – Market size and forecast 2021-2026 ($ million)
- Exhibit 67: Data Table on China – Market size and forecast 2021-2026 ($ million)
- Exhibit 68: Chart on China – Year-over-year growth 2021-2026 (%)
- Exhibit 69: Data Table on China – Year-over-year growth 2021-2026 (%)
- 7.10 Germany – Market size and forecast 2021-2026
- Exhibit 70: Chart on Germany – Market size and forecast 2021-2026 ($ million)
- Exhibit 71: Data Table on Germany – Market size and forecast 2021-2026 ($ million)
- Exhibit 72: Chart on Germany – Year-over-year growth 2021-2026 (%)
- Exhibit 73: Data Table on Germany – Year-over-year growth 2021-2026 (%)
- 7.11 UK – Market size and forecast 2021-2026
- Exhibit 74: Chart on UK – Market size and forecast 2021-2026 ($ million)
- Exhibit 75: Data Table on UK – Market size and forecast 2021-2026 ($ million)
- Exhibit 76: Chart on UK – Year-over-year growth 2021-2026 (%)
- Exhibit 77: Data Table on UK – Year-over-year growth 2021-2026 (%)
- 7.12 Japan – Market size and forecast 2021-2026
- Exhibit 78: Chart on Japan – Market size and forecast 2021-2026 ($ million)
- Exhibit 79: Data Table on Japan – Market size and forecast 2021-2026 ($ million)
- Exhibit 80: Chart on Japan – Year-over-year growth 2021-2026 (%)
- Exhibit 81: Data Table on Japan – Year-over-year growth 2021-2026 (%)
- 7.13 Market opportunity by geography
- Exhibit 82: Market opportunity by geography ($ million)
8 Drivers, Challenges, and Trends
- 8.3 Impact of drivers and challenges
- Exhibit 83: Impact of drivers and challenges in 2021 and 2026
9 Vendor Landscape
- 9.2 Vendor landscape
- Exhibit 84: Overview on Criticality of inputs and Factors of differentiation
- 9.3 Landscape disruption
- Exhibit 85: Overview on factors of disruption
- 9.4 Industry risks
- Exhibit 86: Impact of key risks on business
10 Vendor Analysis
- 10.1 Vendors covered
- Exhibit 87: Vendors covered
- 10.2 Market positioning of vendors
- Exhibit 88: Matrix on vendor position and classification
- 10.3 FORGE Supplements
- Exhibit 89: FORGE Supplements – Overview
- Exhibit 90: FORGE Supplements – Product / Service
- Exhibit 91: FORGE Supplements – Key offerings
- 10.4 FUTURE KIND
- Exhibit 92: FUTURE KIND – Overview
- Exhibit 93: FUTURE KIND – Product / Service
- Exhibit 94: FUTURE KIND – Key offerings
- 10.5 Jarrow Formulas Inc.
- Exhibit 95: Jarrow Formulas Inc. – Overview
- Exhibit 96: Jarrow Formulas Inc. – Product / Service
- Exhibit 97: Jarrow Formulas Inc. – Key offerings
- 10.6 Kikkkoman
- Exhibit 98: Kikkkoman – Overview
- Exhibit 99: Kikkkoman – Product / Service
- Exhibit 100: Kikkkoman – Key offerings
- 10.7 Natrol LLC
- Exhibit 101: Natrol LLC – Overview
- Exhibit 102: Natrol LLC – Product / Service
- Exhibit 103: Natrol LLC – Key offerings
- 10.8 Nestle SA
- Exhibit 104: Nestle SA – Overview
- Exhibit 105: Nestle SA – Business segments
- Exhibit 106: Nestle SA – Key news
- Exhibit 107: Nestle SA – Key offerings
- Exhibit 108: Nestle SA – Segment focus
- 10.9 NOW Health Group Inc.
- Exhibit 109: NOW Health Group Inc. – Overview
- Exhibit 110: NOW Health Group Inc. – Product / Service
- Exhibit 111: NOW Health Group Inc. – Key offerings
- 10.10 Pure Encapsulations LLC
- Exhibit 112: Pure Encapsulations LLC – Overview
- Exhibit 113: Pure Encapsulations LLC – Product / Service
- Exhibit 114: Pure Encapsulations LLC – Key offerings
- 10.11 Vital Amine Inc.
- Exhibit 115: Vital Amine Inc. – Overview
- Exhibit 116: Vital Amine Inc. – Product / Service
- Exhibit 117: Vital Amine Inc. – Key offerings
- 10.12 Wonder Laboratories
- Exhibit 118: Wonder Laboratories – Overview
- Exhibit 119: Wonder Laboratories – Product / Service
- Exhibit 120: Wonder Laboratories – Key offerings
11 Appendix
- 11.2 Inclusions and exclusions checklist
- Exhibit 121: Inclusions checklist
- Exhibit 122: Exclusions checklist
- 11.3 Currency conversion rates for US$
- Exhibit 123: Currency conversion rates for US$
- 11.4 Research methodology
- Exhibit 124: Research methodology
- Exhibit 125: Validation techniques employed for market sizing
- Exhibit 126: Information sources
- 11.5 List of abbreviations
- Exhibit 127: List of abbreviations
About Us
Technavio is a leading global technology research and advisory company. Their research and analysis focus on emerging market trends and provide actionable insights to help businesses identify market opportunities and develop effective strategies to optimize their market positions. With over 500 specialized analysts, Technavio’s report library consists of more than 17,000 reports and counting, covering 800 technologies, spanning 50 countries. Their client base consists of enterprises of all sizes, including more than 100 Fortune 500 companies. This growing client base relies on Technavio’s comprehensive coverage, extensive research, and actionable market insights to identify opportunities in existing and potential markets and assess their competitive positions within changing market scenarios.
Contact
Technavio Research
Jesse Maida
Media & Marketing Executive
US: +1 844 364 1100
UK: +44 203 893 3200
Email: [email protected]
Website: www.technavio.com/
SOURCE Technavio